
Page 22 - {PDF Title}
P. 22
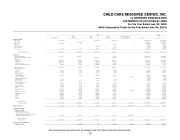
                                                                                       Revenue and support
115,347,568 - 2,544,873 Contributions - In-kind contributions - Interest income - Other income 10,073
$- $ 18,194,974
24,813,301 $ -
4,045,040 $ -
- $ -
-
-
144,205,909 $ 18,194,974
126,847,800 14,862,206 2,052,071 60,221 98,414 4,118 200,648
Grant revenue $ Fees for services
Family fees
65 - - - 2,441
-
- 81,800 - 5,700 193,438
2,544,938 81,800 129,806 5,700 236,308
Expenditures
Total revenue and support 117,902,514
18,197,480
24,973,463
4,325,978
-
165,399,435
144,125,478
Direct provider payments 96,171,997 Payments made for contracted services - Personnel costs
13,369,770 -
- 10,564,577
1,066 905,605
- - - - - - -
109,542,833 11,470,182
98,165,666 6,072,520
Salaries 13,045,544 Payroll taxes 1,084,761 Employee benefits 1,601,727 Workers' compensation insurance 131,365
3,101,625 250,837 364,581
8,492,109 738,961 1,108,650 380,658
1,847,435 154,013 195,082
26,486,713 2,228,572 3,270,040
23,568,801 2,008,156 3,212,296
Personnel expenses 15,863,397 Other operating expenses
27,556 3,744,599 27,519
10,720,378
19,716 2,216,246 41,952
-
559,295 32,544,620 154,547
687,174 29,476,427 187,987
Advertising 71,652 Bank fee 23,247 Business insurance 98,560 Conferences and
4,283 21,418
13,424 1,123 78,566
2,314 5,288
- - - - -
30,967 203,832 - 487,583 916,720 129,806 5,222 160,532
34,432 201,775
staff development 181,391 Depreciation expense - In-kind professional services - Interest expense 4,667 Membership dues 138,435 Office equipment leases
25,522 - - - 15,124
202,618 - 129,806 - 4,047
78,052 - - 555 2,926
916,720 - - -
344,086 810,673 98,414 1,050 141,621
and maintenance 161,857 Other expenses 70,699 Postage and delivery 345,225 Printing 84 Professional services 632,970 Rent 1,932,953
34,118 47,526 52,444
71,305 71,267 12,094
3,423 116,082 19,432 68,712 222,733 243,958 32,860 4,549 112,221 40,902 43,746 32,437
- - - - -
270,703 305,574 429,195
277,189 176,505 375,559
Repairs and maintenance Software costs
Supplies
Telephone
250,849 285,467 828,051 342,060
28 117,505 303,797 33,889 60,860 75,576 43,724 17,685 43,033
2,185 350,722 992,232 177,440 148,872 502,061
125,443 - - - - - -
71,009 1,323,930 3,598,383 495,038 499,748 1,517,909 344,633 246,743 414,876
49,429 848,894 3,426,811 557,060 533,445 1,277,852 383,208 152,135 396,539
Travel Utilities
79,267 208,580
(82,053) 106,045 130,826
Total expenditures
per audited financials
117,691,408 211,106
18,038,420 159,060 $
24,197,535 775,928 $
4,195,059 130,919 $
1,042,163 (1,042,163) $
165,164,585 234,850 $
143,989,277 136,201
Change in net assets
$
$
Adjustments to reconcile to regulatory reporting
Capitalized renovation and
repairs expensed on AUD forms
- 211,106
- 48,400
- 775,101
- 97,190
- (1,131,797)
- -
- -
Capitalized equipment, renovations and repairs expensed on reports to funders
Total expenditures by funder categories
117,902,514
18,086,820
24,972,636
4,292,249
(89,634)
165,164,585
143,989,277
Revenues over (under) expenditures for regulatory reporting
$
-
$
110,660 $
827 $
33,729 $
89,634 $
234,850 $
136,201
CDE Programs
County Head Child Care Start
All Other Programs
Property & Equipment and Deferred Rent
Total
Total
The accompanying notes are an integral part of these financial statements. 19
2015
2014
- 129,806 - 30,356
- - -
CHILD CARE RESOURCE CENTER, INC. (A NONPROFIT ORGANIZATION)
STATEMENTS OF ACTIVITIES BY AREA For the Year Ended June 30, 2015 (With Comparative Totals for the Year Ended June 30, 2014)
