
Page 8 - Microsoft Word - {8163B450-FFDE-4294-8624-C6B2D90F75D8}
P. 8
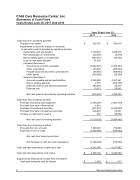
Child Care Resource Center, Inc. Statements of Cash Flows
Years Ended June 30, 2017 And 2016
Cash flows from operating activities
Change in net assets
Adjustments to reconcile change in net assets
to net cash (used in) provided by operating activities Depreciation and amortization
Net realized gain on investments
Net unrealized gains on investments
Loss on fixed asset disposal (Increase) decrease in
Government contracts receivable
Other receivables
Prepaid expenses and other current assets Other assets
Increase (decrease) in
Accounts payable and accrued liabilities Due to funding agencies
Deferred revenue and advance payments Deferred rent
Net cash (used in) provided by operating activities
Cash flows from investing activities
Purchase of property and equipment Proceeds from sale of fixed assets Purchase of investment securities Proceeds from sale of investment securities Increase in cash held in reserve
Net cash used in investing activities
Cash flows from financing activities Proceeds from line of credit Payments on line of credit
Net cash from financing activities
Net decrease in cash and cash equivalents Cash and cash equivalents, beginning of year
Cash and cash equivalents, end of year
Supplemental Disclosures of Cash Flow Information Cash paid during the year for interest
6
Years Ended June 30,
    $
2017
422,167
1,120,018 (22,097) (267,441)
67,535
(5,582,821) 403,846
(66,446) (149,000)
3,389,922 2,791 389,458 15,671
(276,397)
(1,366,267) 4,241
(374,727) 226,463 257
(1,510,033)
7,300,000 (7,300,000)
- (1,786,430)
6,242,596 4,456,166
$
2016
260,819
1,099,376 (6,376) (94,534)
-
(1,262,067) (330,004) (108,662)
(30,204)
4,547,561 (816,330)
20,474 29,041
3,309,094
(1,487,379) -
(2,350,000) 62,301 90,588
(3,684,490)
750,000 (750,000)
- (375,396)
6,617,992 6,242,596
                      $ $
$
    1,452
See accompanying notes.
$
417
