
Page 9 - Strengthening California’s Emergency Child Care Bridge Program
P. 9
Strengthening California’s Emergency Child Care Bridge
Methods
The following is a brief description of the study methods For more information on the study’s methodology, please see Appendix A Based on the research questions approved by all three funding agencies, the CCRC Research team conducted 122 key informant interviews (KIIs) across both study years with Child Welfare and ECE Bridge Program administrators, child care navigators, and trauma-informed trainers/coaches who had daily contact with caregivers and child care providers receiving services through the Bridge Program The Research team aimed to collect KIIs with 4-5 Bridge staf per county per study year The study design was flexible since counties were able to tailor the program to meet the needs of the county, which resulted in stafing patterns that varied across counties Additionally, in one county there were two R&R agencies implementing the program A list of KIIs conducted by county and staf position type can be found in Appendix B Where findings are similar across years 1 and 2, this is noted and year 2 data are presented for the sake of brevity and clarity
Caregiver Demographics
Across both study years, the Research team collected 346 online surveys and 52 KIIs with caregivers (eg foster parents, resource parents, relative caregivers, parenting foster youth, etc) Online surveys were collected from 11 of the 12 sample counties The one county who was not represented in the survey had served fewer than 10 families, and none of those caregivers responded to the invitations to participate in the survey Appendix C details the number of online surveys received by county While, surveys were available in both English and Spanish, only 11 surveys across both years of the study were completed in Spanish Therefore, no language comparison was conducted for this study
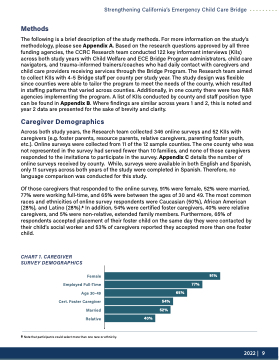
Of those caregivers that responded to the online survey, 91% were female, 52% were married, 77% were working full-time, and 65% were between the ages of 30 and 49 The most common races and ethnicities of online survey respondents were Caucasian (50%), African American (28%), and Latino (28%)8 In addition, 54% were certified foster caregivers, 40% were relative caregivers, and 5% were non-relative, extended family members Furthermore, 65% of respondents accepted placement of their foster child on the same day they were contacted by their child’s social worker and 53% of caregivers reported they accepted more than one foster child
CHART 1. CAREGIVER SURVEY DEMOGRAPHICS
Female Employed Full-Time Age 30-49 Cert. Foster Caregiver Married Relative
8 Note that participants could select more than one race or ethnicity
91%
54%
65%
77%
52%
40%
2022| 9
