
Page 20 - FY 2021-2022 Audited Financial Statements
P. 20
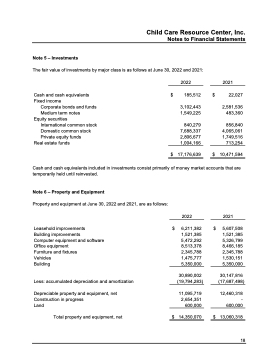
Note 5 – Investments
The fair value of investments by major class is as follows at June 30, 2022 and 2021: 2022
2021
22,027
2,581,536 483,360
856,840 4,065,061 1,749,516
Child Care Resource Center, Inc. Notes to Financial Statements
   Cash and cash equivalents Fixed income
Corporate bonds and funds
Medium term notes Equity securities
International common stock Domestic common stock Private equity funds
Real estate funds
$
185,512
3,102,443 1,549,225
840,279 7,688,337 2,806,677 1,004,166
$
    $ 17,176,639
713,254 $ 10,471,594
    Cash and cash equivalents included in investments consist primarily of money market accounts that are temporarily held until reinvested.
Note 6 – Property and Equipment
Property and equipment at June 30, 2022 and 2021, are as follows:
Leasehold improvements
Building improvements
Computer equipment and software Office equipment
Furniture and fixtures Vehicles
Building
Less: accumulated depreciation and amortization
Depreciable property and equipment, net Construction in progress
Land
Total property and equipment, net
$
2022
6,211,382 1,521,385 5,472,292 8,513,378 2,345,788 1,475,777 5,350,000
30,890,002 (19,794,283)
11,095,719 2,654,351 600,000
14,350,070
$
2021
5,607,508 1,521,385 5,326,799 8,466,185 2,345,788 1,530,151 5,350,000
30,147,816 (17,687,498)
12,460,318 - 600,000
13,060,318
            $
$
    18
