
Page 15 - Microsoft Word - School Readiness and Parenting Outcomes from ECE-Full Report.doc
P. 15
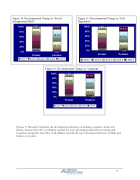
 Figure 14. Developmental Change in “Social Interpersonal Skills”
 100% 80% 60% 40% 20% 0%
0.9%
6.2%
   34.1% 6.4%
Posttest
 0.5%
 Pretest
10.8%
   29.1%
51.1%
48.3%
  12.7%
 Level 1 Level 2 Level 3 Level 4 Level 5
      Figure 15. Developmental Change in “Self Regulation”
 100% 80% 60% 40% 20% 0%
1.0%
   19.5%
  36.0%
45.5%
 42.5%
 8.6%
29.7% 4.9%
      11.9%
      Pretest
0.5%
Posttest
Level 1 Level 2 Level 3 Level 4 Level 5
      Figure 16. Developmental Change in “Language”
 1.7%
100% 80% 60% 40% 20%
0%       0.3% Pretest Posttest
      11.2%
20.1%
   37.7%
45.6%
   40.5%
  9.0%
28.7%
 5.3%
   Level 1 Level 2 Level 3 Level 4 Level 5
     Figures 17 through 21 illustrate the developmental increases in learning, cognition, math, and literacy. Greater than 90% of children reached the top 3 developmental levels in Learning and Cognition and greater than 85% of all children reached the top 3 developmental levels in Math and Literacy at posttest.
 12
