
Page 10 - Microsoft Word - Impact of Subsidized Child Care-Full Report.doc
P. 10
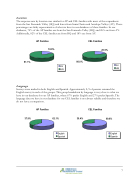
Location
The response rate by location was similar for AP and CEL families with most of the respondents from the San Fernando Valley (HQ) and fewer from Santa Clarita and Antelope Valleys (AV). These percentages are fairly representative of what we have in our databases of these families. In our databases, 74% of the AP families are from the San Fernando Valley (HQ) and 26% are from AV. Additionally, 82% of the CEL families are from HQ and 18% are from AV.
AP Families 18.9%
CEL Families 20.0%
  81.1%
Language
80.0%
 Surveys were mailed in both English and Spanish. Approximately 2/3 of parents returned the English survey in each of the groups. This group breakdown by language is very close to what we have in our database for our AP families, where 67% prefer English and 27% prefer Spanish. The language data we have in our database for our CEL families is not always reliable and therefore we do not have a comparison.
37.9%
62.1% 30.4%
69.6%
AP Families
CEL Families
AV HQ
 AV HQ
    English Spanish
English Spanish
  7
