
Page 8 - Microsoft Word - Impact of Subsidized Child Care-Full Report.doc
P. 8
Demographics
Surveys were distributed to all 6,733 families on the CEL in CCRC’s service area and all 689 families served through our AP program. Of the CEL families, there were 737 whose addresses were no longer valid, leaving 5,996 families who received a survey. Of the AP families, 36 had an invalid address, leaving 653 families who received a survey. Of the 5,996 families from the CEL group, we received 1,234 surveys (20.6%) and of the 653 AP families, we received 169 surveys (25.9%). These sample sizes are statistically representative of their particular group (i.e., the CEL sample size is statistically representative of the full CEL group to whom we sent surveys).
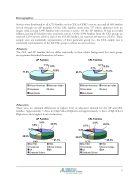
Ethnicity
The CEL and AP families did not differ statistically in their ethnic background. For each group, most parents described themselves as Latino.
AP Families
7.1% 1.2% 1.2%
16.0%
CEL Families
Education
71.6%
65.7%
There were no statistical differences in highest level of education attained for the AP and CEL families. Approximately 1⁄4 have no High School Diploma and approximately 1⁄4 have a High School Diploma as their highest level of education.
AP Families
CEL Families 2.0%
8.7% 6.3%
23.6%
2.1%
9.1% 0.5% 13.0%
African-American American Indian Caucasian Latino Multi-Racial
African-American American Indian Caucasian Latino Multi-Racial
3.6% 6.0%
28.9%
2.4% 23.5% 27.1%
22.5%
28.3%
8.4%
8.7%
No HSD Vocational
AA
Graduate School
HSD
Some College BA
No HSD Vocational
AA
Graduate School
HSD
Some College BA
5
